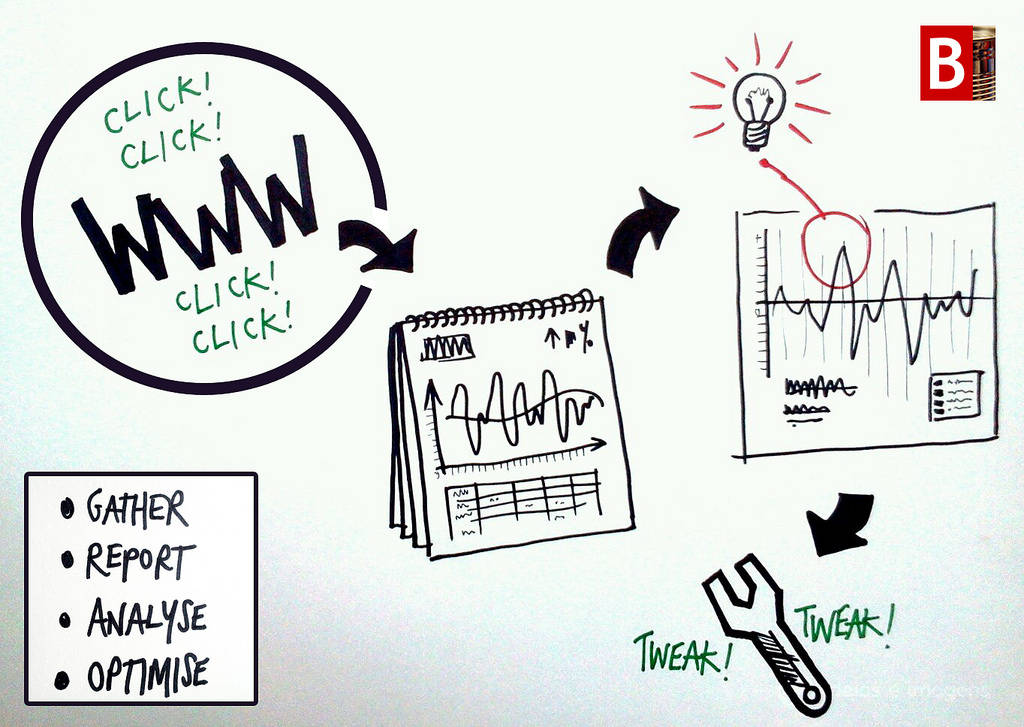
[Image: Web Analytics Framework by James Royal-Lawson under Creative Commons]
In January 2015, the big boys in digital media, especially the ones in cars, pretty much had the market tied up. On one hand were the lead generation platforms such as CarWale, CarDekho and CarTrade which had raised tens of millions of dollars in new funding. On the other side were the big media brands Autocar, Zigwheels, TopGear, etc.
With about 300,000 monthly visits CarToq was seen as one among the many auto content sites at that time. CarToq was our attempt at a digital content play, bootstrapped with a small team of car enthusiasts and very little money to spend either in marketing or technology.
We weren’t sure where we were going with it, until a potential buyer evinced interest in our site. That got us thinking—perhaps we had something that could be significant too. So we started putting some serious effort into CarToq.
Last month, in March, we overtook Autocar in traffic, clocking 2.1 million visits, making us the No. 2 content site in auto after Zigwheels. Apart from audience leadership, we have some of the best metrics in terms of engagement too. Our bounce rate (percentage of single-page visits), for instance, is the lowest among any auto site in the country. Most importantly, we acquire new users at costs that are a fraction of what anyone else is able to achieve.
So we became big among car sites in India. But that’s not the real point here. It’s how we managed to get to be one of the big guys—that’s a story worth telling.
We stumbled onto a path that is probably not so well travelled. We discovered Little Data.
Fighting against big brands and deep pockets, we knew our only hope lay in really understanding our audiences well. And then rapidly adapt to what those users were saying and responding to.
To do that, we collected data of all sorts—new, old, structured, not-so-structured, social, intent, behavioural. We tracked it relentlessly, every day—and through the day. Then we sliced it and diced it in typical ways and not-so-typical ways, till we started extracting rich insights out of it.
And before you start imagining a large data team, handling large data sets, well, the entire CarToq team, including content, operations and marketing, was less than 15. Moreover, we didn’t have the ability to handle large data sets, nor did we have very deep skills in analytics.
What we did figure out was a way to plug away at smaller chunks of data, iterate using approximations until we got usable answers, and bring this data-centricity to everyone in the team on a daily basis.
We gave this our very own name—the Little Data approach. Why this name? Because our experience bears out that Little Data has a very small effort and capability threshold to cross. Here’s how we overcame that threshold and set out on the data path.
Data is everyone’s job
Looking back, if we had to choose the one factor that made the biggest difference in our case, it would have to be this—it was a mindset shift about data. It wasn’t about everyone having to collate or crunch data, but it was about making data everyone’s business in the team.
Take for instance how we fixed the most vexing question in our business: what content would work best for our readers? Earlier, we would go at this problem in decidedly enjoyable editorial discussions, where everyone basically spouted opinions. Sometimes, we would get it right, and often we wouldn’t.
At some stage, we started sharing site traffic updates—through the day—with the team. Everyone started seeing how their story was doing. That data started telling a story to each person in a manner that was utterly unambiguous.
Gradually—and this happened over months—everyone started checking traffic data for their content on their own. Over time, consensus on what we should and shouldn’t do started getting premised mostly around the content analytics.
It took time, but it was a big shift. When that happened, data became everyone’s business in the team. The data team then started focusing on providing better and easier dashboards to use.
In hindsight, figuring out that easy-to-use data for everyone was critical—it had to be something that provided a simple answer to an everyday business context for the team.
Keep approximating until usable answers emerge
Often, a pre-requisite to getting meaningful answers requires processing large data sets—that’s what Big Data promises, and indeed delivers. But for us, who did not have the competency to start on that path, we have tried something else.
Among other things, we need to track topic trending signals online—which themes are doing well, among our competitors, in social media and so on. There are sentiments tracking tools that do fairly sophisticated analysis of trending content but they are pretty expensive (starting from $1,000 a month.)
We took a much more rudimentary approach. For a bunch of auto content sites, both in India and abroad, we tracked content they were publishing from RSS feeds, etc. We then also pulled their engagement data (likes, shares) directly from the Facebook application program interface (API).
Juxtaposing all competitor content with their social data isn’t a big deal. But it started giving us enough insights to start generating some new content ideas. Gradually, we then added our own content’s social data to this dashboard, and improved our ability to generate insights about trending content.
Our approach wasn’t comprehensive by any stretch but it provided enough actionable insights to do the job for us. We do this a lot—take the most accessible approach available to us, keep approximating with our analysis till we start getting useful insights.
Segregate data context for tactical and strategic
This took us the longest to figure out. Here’s a quick test. For your web analytics reports, how different are the reports for daily, weekly and monthly time-periods? For us, they weren’t and that would confuse us.
So for instance, we found that while our month-on-month graph for visits was always an upward graph, the weekly graph was a bit squiggly. When we zoomed in further, for a day-wise view, we saw far too many peaks and valleys.
For the longest time, we tried to find correlations between these three sets of data, with little success. And then we asked ourselves: what is our primary requirement from daily data, and what do we really need from our monthly data?
It turned out that daily data, and intra-day data, is essentially needed for tactical decisions. If a certain piece of content is getting good response, should we market that content more aggressively, now? Is Facebook giving us a good price now for our campaign? And so on.
The daily data analysis had to be limited to answering tactical questions. Looking at the daily data for a 30-day period had limited utility beyond that. That’s how we started building clearly segregated context for all our analytics.
Unless you ask the right questions of your data, the answers you get aren’t going to be very helpful.
In conclusion: there are a lot of easy pickings for data-driven businesses today. Two, all businesses, including smaller companies, can derive much value from what we call the Little Data approach. Three, more than deep data expertise, it’s the focus that senior management can bring to this practice that will determine outcomes.
In other words, be data-genic.
In the next piece, let’s look at where data can be put to use for quick wins.
Related Articles
1. Adapting to technological disruption
2. The nonsense that is gut instinct